Some days ago I came across this interesting post from Pam Denny that describes the 80/20 rule. Based on this empirical rule 80% of the report processing is done by only 20% of used reports.
That’s why I developed a simple SQL query that uses the LASTRUNDURATION field of the REPORT table to list the report that have the longest execution time.
SELECT lastrunduration, reportname, description, appname, lastrundate
FROM report
WHERE lastrunduration IS NOT NULL
ORDER BY lastrunduration DESC
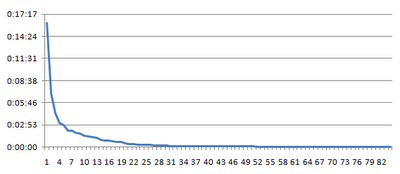
Running this query on a real Maximo production database I got the following figure.
This diagram is very interesting because it perfectly confirms the validity of the 80/20 rule.
The problem with the previous query is that it considers only the last execution time of each report. However, there is an interesting hidden table called REPORTUSAGELOG that stores some basic statistics of all report executions.
With this table we can calculate the average execution time of all the available reports.
SELECT AVG(enddate-startdate)*24*60, reportname
FROM reportusagelog
GROUP BY reportname
ORDER BY AVG(enddate-startdate) DESC
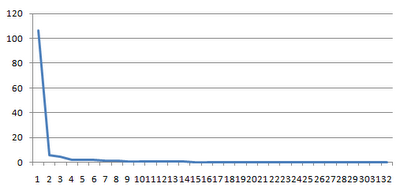
This new query spotted a specific report which average execution time is 106 minutes.
Once you have identified the troubled reports you can start to analyze the performance issues.
This post describes the technique I typically use: Troubleshooting Birt report performances.
More insights on this topic can be found here.
Maximo Health Check report
To help troubleshoot performance issues in Maximo I have also developed the Maximo Health Check report . Report performances, database size, crontasks/escalations execution times and much more information are reported in a single report.


