This entry is part of the Maximo Java Development series.
Debugging is a great aid in developing Maximo/TPAE customizations in Java. This powerful technique, albeit simple, is too often ignored or neglected by less experienced developers. In this tutorial I will show how to connect Eclipse to a remote Maximo server in debug mode.
Here we go.
Enable debug mode in WebSphere
First thing to do is to enable debugging of the MXServer application server in WebSphere.
Open WAS console and find the MXServer application server under ‘Servers’ group.
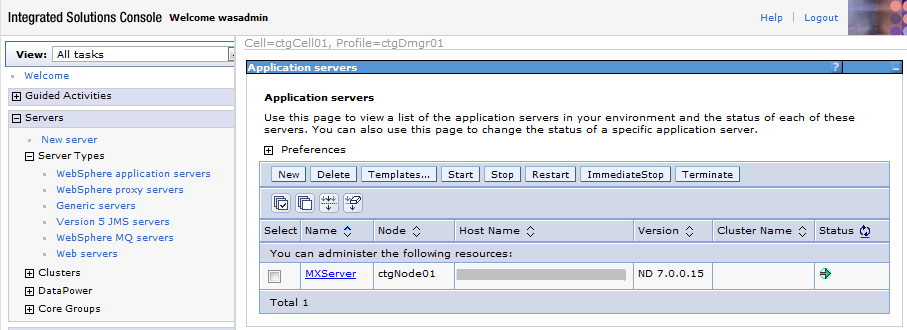
Click on the MXServer link and search for the ‘Process Definition’ under the ‘Java and Process Management’ group on the right side.

Now click on ‘Java Virtual Machine’ on the right and search the ‘Debug Mode’ checkbox. Check the ‘Debug Mode’ flag and take note of the debug port on the text box below (7777).
Now restart MXServer and you are ready to debug.
Attach the Eclipse debugger to MXServer
Launch Eclipse and open your Maximo Java project. I hope you have one:-)
Click on the drop-down arrow next to the Debug Menu button and select Debug Configurations.

Select ‘Remote Java Application’ then click on the ‘Add’ button on the upper-left and fill the Connection properties with the hostname of the Maximo application server and the debug port as configured in WebSphere.

Click on Debug button.
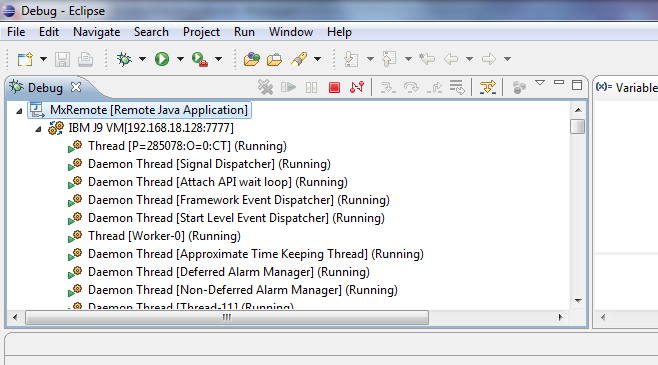
Now the Debug perspective should open automatically. If not, select Window > Open Perspective > Other > Debug. You should see something like this in the Debug view.
Now you are ready to debug. Try to put a breakpoint in your custom code and see what happens.
A mayor advantage of debugging is that you can hot-swap your code changes into the application server. All you have to do is to save the Java class and Eclipse will automatically compile and replace it in Maximo as long as you are connected.
Unfortunately this not always work and sometimes you get the following error.
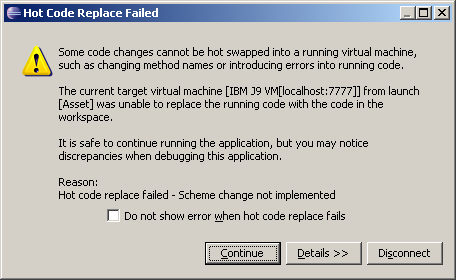
In such cases, you have to stop the application server, replace the class tree and start over.
This technique, paired with the Rapid Java class deployment on WebSphere, can greatly speedup your job leaving some free time to go on Facebook 🙂
Hi Bruno,
I tried the above steps. I got till
Click on Debug button.
Now the Debug perspective should open automatically. If not, select Window > Open Perspective > Other > Debug. You should see something like this in the Debug view.
After this when I try to debug it gives me below error
Failed to connect to remote VM. Connection timed out.
org.eclipse.jdi.TimeoutException
I have tried increasing the timeout and other things but of no use.
Any ideas?
I am using eclipse on clients Virtual machine
The 'Failed to connect to remote VM' error can have different causes.
1. Debug mode is not enabled. Have you enabled it? Did you restarted the app server?
2. Eclipse is not able to connect. Is the hostname right? Try to ping it. Is the port right? Try to telnet on it.
3. The connection is slow. Try to increase the timeout under Preferences – Java – Debug – Debugger timeout. The default is 3000 (3 seconds). Try setting it to 10 seconds.
Regards
Hi Bruno,
Thanks for the quick reply.:)
I have tried all the above three points
1.yeah I have enabled debug mode and restarted the app server.
2.Ping and telnet both were successful.
3.I tried setting it till 50 sec but of no use.
Any other ideas or mistake you think I might be doing are appreciated 🙂
Hi Bruno,
Thanks for the help. The issue got resolved ,don't know how but now I can debug the application.
I appreciate the effort you putting in this blog.
Keep up the good work 🙂
God bless you..
Nice work
I will try it right now
Keep up
Have you change file? –
c:\ibm\SMP\maximo\applications\maximo\properties\maximo.properties
You must write row with current password of user "maximo"
mxe.db.password=Passw0rd
Thank you Bruno!
But you do not describe about connection property file: "C:\ibm\SMP\maximo\applications\maximo\properties\maximo.properties"
May be you add this information in this article?
I don't think there is any need to modify the maximo.properties to enable debug.
But, if not to insert this parameter "mxe.db.password=Passw0rd" connection can't be established. Isn't it?
Hello Bruno!, I'm trying to debug like you said, but I started debug and nothing happens, I mean, debug is running and I can suspend it, but that's all. Shouldn't it be showing the start page?.
Thanks, and sorry my English!.
Regards
No it will not display and start page.
You have to set a breakpoint and pass trough it using the web UI.
For example if you have overrided the Workorder.add method you can create a WO from the UI and the application will stop at your breakpoint.
Bruno,
Would love to thank you for being there for all of your followers.
I got couple of questions for you:
1- In Issue and Transfer app, why Maximo runs the Save method on each line as individually instead of dealing with the whole set at the same time, so what should I do if I want to update table in the DB just one time per transaction not per record.
2- In Select Item for Return, the IssueTyoe is always Issue when it suppose to be Return..
Thanks again for your support.
How can we debug the same by using weblogic application server?
Yes you can.
Try google something like 'weblogic debug eclipse'.
I have followed above steps.
I am not able to understand how maximo or websphere will get to know about my custom class in eclipse. Which is a bean class on a button. I have applied breakpoints and now clicking the button. I cant see debug going on
I ma getting refused error.
I can ping but I cannot telnet.
Any idea what could be the cause?
nice blog. Thank you.
Hi bruno,
For me debug mode step into is not working. so am not able to check manually by pressing F5. And also when i point on any variable sometime it is not showing the value?